

Sponsored Content Free AI and Data Courses with 365 Data Science—100% Unlimited Access until Nov 21 From November 6 to November 21, 2025 (starting at 8:00 a.m. UTC), 365 Data Science will grant free access to its entire learning platform. This limited-time opportunity allows aspiring AI professionals and data enthusiasts to enhance their skills and gain practical, hands-on experience—completely free of charge. Tradition and Mission Now in its fifth year, 365 Data Science reaffirms its dedication to providing accessible, high-quality education through its annual Free Access Initiative, first introduced during the global pandemic in 2020. CEO Ned Krastev emphasizes the growing importance of AI-related skills, stating that “the AI and data landscape is evolving faster than ever, creating extraordinary opportunities for those ready to embrace new technologies.” The initiative’s impact has grown dramatically—2024 marked its most successful edition yet, attracting over 200,000 unique users from 215 countries, who collectively logged 6.9 million minutes of learning and earned more than 35,000 certificates. Krastev adds, “Artificial intelligence is reshaping industries at an unprecedented pace. Gaining an understanding of how AI systems are built, deployed, and integrated has become essential for anyone pursuing a data-driven career. At 365 Data Science, our goal is to close that gap by helping learners develop both data literacy and hands-on expertise in AI engineering and intelligent agents—the defining skills of tomorrow’s tech professionals.” Free AI and Data Courses with 365 Data Science—100% Unlimited Access until Nov 21 365 Data Science empowers learners to go beyond traditional data analytics and step into the era of AI engineering and intelligent agents—equipping them with the expertise to design, deploy, and work alongside AI systems capable of reasoning, planning, and acting autonomously. What’s Included? During this limited-time period, learners will gain unrestricted access to the entire 365 Data Science platform—a comprehensive destination for mastering data and AI. The platform offers over 117 expert-led courses, covering everything from foundational data skills to advanced topics in AI, machine learning, and AI engineering. Participants can gain practical experience through real AI and data projects that mirror actual work scenarios, allowing them to apply their knowledge effectively. Newly introduced interactive exercises and guided challenges strengthen understanding and reinforce key concepts. Moreover, 365 Data Science provides structured, career-focused learning paths that lead users step by step—from beginner to job-ready professional—offering a clear roadmap to success in today’s AI-driven world. Certifications that Open Doors In today’s fast-changing job market, recognized certifications are essential for standing out. Through this Free Access Initiative, 365 Data Science enables learners to earn industry-recognized certificates completely free of charge. These credentials demonstrate practical expertise in data analytics, AI, and machine learning, boosting participants’ employability and credibility with employers across the globe. The initiative bridges the gap between education and career advancement by offering verifiable, career-enhancing certifications that highlight real-world competence. Don’t Miss this Opportunity In a world increasingly driven by data and artificial intelligence, staying ahead of the curve is more important than ever. This three-week open-access period from 365 Data Science offers a unique opportunity to invest in your future—whether you’re beginning your journey, changing careers, or advancing your skills in AI and data. Don’t miss your chance to gain in-demand expertise, earn industry-recognized certificates, and take the next step toward a rewarding career in data science and AI engineering. The future belongs to those who prepare for it today—start your journey for free with 365 Data Science.

Samsung To Invest $309 Billion Over Next 5 Years | Technology News
Seoul: South Korean tech giant Samsung Group unveiled on Sunday a 450 trillion-won ($309.1 billion) investment plan for the next five years, as part of broader efforts to ramp up domestic investment after Seoul concluded its trade deal with the United States. Samsung Electronics Co., the crown jewel of the country’s No. 1 conglomerate, will push to launch the framework construction of one of its chip plants in the main Pyeongtaek compound, home to Samsung’s semiconductor manufacturing, the company said. The decision, which also includes investment plans for research and development, was reached at a recent ad-hoc management committee, it said, reports Yonhap news agency. The new Line 5 chip production line is slated to begin commercial operations in 2028, helping the company better meet rising demand for memory chips amid the global surge in artificial intelligence (AI). Samsung SDS Co., the ICT unit of Samsung, will build a large-scale AI data center in South Jeolla Province in the country’s southwest. The AI data center aims to acquire 15,000 graphics processing units by 2028 and provide them to universities, startups and small- and medium-sized enterprises. Add Zee News as a Preferred Source The battery-making unit, Samsung SDI Co. is looking at establishing a domestic production line for next-generation batteries, including all-solid-state batteries, possibly in the southeastern city of Ulsan. Samsung Display Co. is set to begin full-scale production next year at its 8.6-generation organic light-emitting diode plant, currently under construction in the central South Chungcheong region. The latest announcement came after South Korea finalized its trade deal with the US on the details of its US$350 billion investment package in the US. market in exchange for reducing U.S. “reciprocal” tariffs to 15 percent from 25 percent. Earlier in the day, leaders of South Korea’s major business conglomerates, including Samsung, SK and Hyundai, met with President Lee Jae Myung to discuss follow-up measures after the conclusion of the trade deal, including efforts to continue the domestic investment flows.
The 7 Statistical Concepts You Need to Succeed as a Machine Learning Engineer
The 7 Statistical Concepts You Need to Succeed as a Machine Learning EngineerImage by Editor Introduction When we ask ourselves the question, “what is inside machine learning systems?“, many of us picture frameworks and models that make predictions or perform tasks. Fewer of us reflect on what truly lies at their core: statistics — a toolbox of models, concepts, and methods that enable systems to learn from data and do their jobs reliably. Understanding key statistical ideas is vital for machine learning engineers and practitioners: to interpret the data used alongside machine learning systems, to validate assumptions about inputs and predictions, and ultimately to build trust in these models. Given statistics’ role as an invaluable compass for machine learning engineers, this article covers seven core pillars that every person in this role should know — not only to succeed in interviews, but to build reliable and robust machine learning systems in day-to-day work. 7 Key Statistical Concepts for Machine Learning Engineers Without further ado, here are the seven cornerstone statistical concepts that should become part of your core knowledge and skill set. 1. Probability Foundations Virtually every machine learning model — from simple classifiers based on logistic regression to state-of-the-art language models — has probabilistic foundations. Consequently, developing a solid understanding of random variables, conditional probability, Bayes’ theorem, independence, joint distributions, and related ideas is essential. Models that make intensive use of these concepts include Naive Bayes classifiers for tasks like spam detection, hidden Markov models for sequence prediction and speech recognition, and the probabilistic reasoning components of transformer models that estimate token likelihoods and generate coherent text. Bayes’ theorem shows up throughout machine learning workflows — from missing-data imputation to model calibration strategies — so it is a natural place to start your learning journey. 2. Descriptive and Inferential Statistics Descriptive statistics provides foundational measures to summarize properties of your data, including common metrics like mean and variance and other important ones for data-intensive work, such as skewness and kurtosis, which help characterize distribution shape. Meanwhile, inferential statistics encompasses methods for testing hypotheses and drawing conclusions about populations based on samples. The practical use of these two subdomains is ubiquitous across machine learning engineering: hypothesis testing, confidence intervals, p-values, and A/B testing are used to evaluate models and production systems and to interpret feature effects on predictions. That is a strong reason for machine learning engineers to understand them deeply. 3. Distributions and Sampling Different datasets exhibit different properties and distinct statistical patterns or shapes. Understanding and distinguishing among distributions — such as Normal, Bernoulli, Binomial, Poisson, Uniform, and Exponential — and identifying which one is appropriate for modeling or simulating your data are important for tasks like bootstrapping, cross-validation, and uncertainty estimation. Closely related concepts like the Central Limit Theorem (CLT) and the Law of Large Numbers are fundamental for assessing the reliability and convergence of model estimates. For an extra tip, gain a firm understanding of tails and skewness in distributions — doing so makes detecting issues, outliers, and data imbalance significantly easier and more effective. 4. Correlation, Covariance, and Feature Relationships These concepts reveal how variables move together — what tends to happen to one variable when another increases or decreases. In daily machine learning engineering, they inform feature selection, checks for multicollinearity, and dimensionality-reduction techniques like principal component analysis (PCA). Not all relationships are linear, so additional tools are necessary — for example, the Spearman rank coefficient for monotonic relationships and methods for identifying nonlinear dependencies. Proper machine learning practice starts with a clear understanding of which features in your dataset truly matter for your model. 5. Statistical Modeling and Estimation Statistical models approximate and represent aspects of reality by analyzing data. Concepts central to modeling and estimation — such as the bias–variance trade-off, maximum likelihood estimation (MLE), and ordinary least squares (OLS) — are crucial for training (fitting) models, tuning hyperparameters to optimize performance, and avoiding pitfalls like overfitting. Understanding these ideas illuminates how models are built and trained, revealing surprising similarities between simple models like linear regressors and complex ones like neural networks. 6. Experimental Design and Hypothesis Testing Closely related to inferential statistics but one step beyond, experimental design and hypothesis testing ensure that improvements arise from genuine signal rather than chance. Rigorous methods validate model performance, including control groups, p-values, false discovery rates, and power analysis. A very common example is A/B testing, widely used in recommender systems to compare a new recommendation algorithm against the production version and decide whether to roll it out. Think statistically from the start — before collecting data for tests and experiments, not after. 7. Resampling and Evaluation Statistics The final pillar includes resampling and evaluation approaches such as permutation tests and, again, cross-validation and bootstrapping. These techniques are used with model-specific metrics like accuracy, precision, and F1 score, and their outcomes should be interpreted as statistical estimates rather than fixed values. The key insight is that metrics have variance. Approaches like confidence intervals often provide better insight into model behavior than single-number scores. Conclusion When machine learning engineers have a deep understanding of the statistical concepts, methods, and ideas listed in this article, they do more than tune models: they can interpret results, diagnose issues, and explain behavior, predictions, and potential problems. These skills are a major step toward trustworthy AI systems. Consider reinforcing these concepts with small Python experiments and visual explorations to cement your intuition.

India’s AI Shift From Pilots To Performance As 47% Enterprises Have Multiple AI Use Cases: Report | Technology News
New Delhi: India’s enterprise AI landscape has reached an inflexion point as nearly half of Indian enterprises (47 per cent) now have multiple Generative AI (GenAI) use cases live while 23 per cent are in pilot stage – marking a decisive shift from pilots to performance, a report said on Sunday. Indian enterprises are demonstrating strong confidence by embedding AI into core business workflows to deliver measurable results. Notably, 76 per cent of business leaders believe that GenAI will have a significant business impact, and 63 per cent feel ready to leverage it effectively, a joint report from EY and Confederation of Indian Industry (CII) stated. “Our survey shows that corporate India has moved beyond experimentation. Nearly half the enterprises already have multiple use cases in production,” said Mahesh Makhija, Partner and Technology Consulting Leader, EY India. Add Zee News as a Preferred Source “For enterprises, the focus must now move from building pilots to designing processes where humans and AI agents collaborate seamlessly,” he added. According to the report, despite optimism, AI and ML investments remain modest in scale. More than 95 per cent of organisations allocate less than 20 per cent of their IT budgets to AI. Only 4 per cent have crossed the 20 per cent threshold, highlighting that while belief is high, funding for scaled AI transformation is still conservative. There is a clear imbalance between conviction and commitment, which is becoming a defining factor in how quickly enterprises extract measurable returns from AI, the report noted. As organisations operationalise AI, the question of return on investment has taken centre stage. The report highlighted that enterprises are moving away from measuring AI success purely through cost reduction and productivity metrics, towards a five-dimensional ROI model encompassing time saved, efficiency gains, business upside, strategic differentiation, and resilience. Meanwhile, as per the report, speed has become the new metric of competitive advantage in AI adoption. As much as 91 per cent of business leaders identified rapid deployment as the single biggest factor influencing their “buy versus build” decisions, underscoring a growing impatience to translate innovation into impact. Over the next 12 months, organisations are expected to focus their GenAI investments on operations (63 per cent), customer service (54 per cent), and marketing (33 per cent), reflecting a clear shift from experimentation to embedding AI in core business functions that directly drive efficiency, experience, and growth. “The coming decade will be defined not only by the speed of AI adoption, but by the quality of its integration into India’s economic and social fabric. This transformation has the potential to add value to India’s growth story,” said Chandrajit Banerjee, Director General, CII.
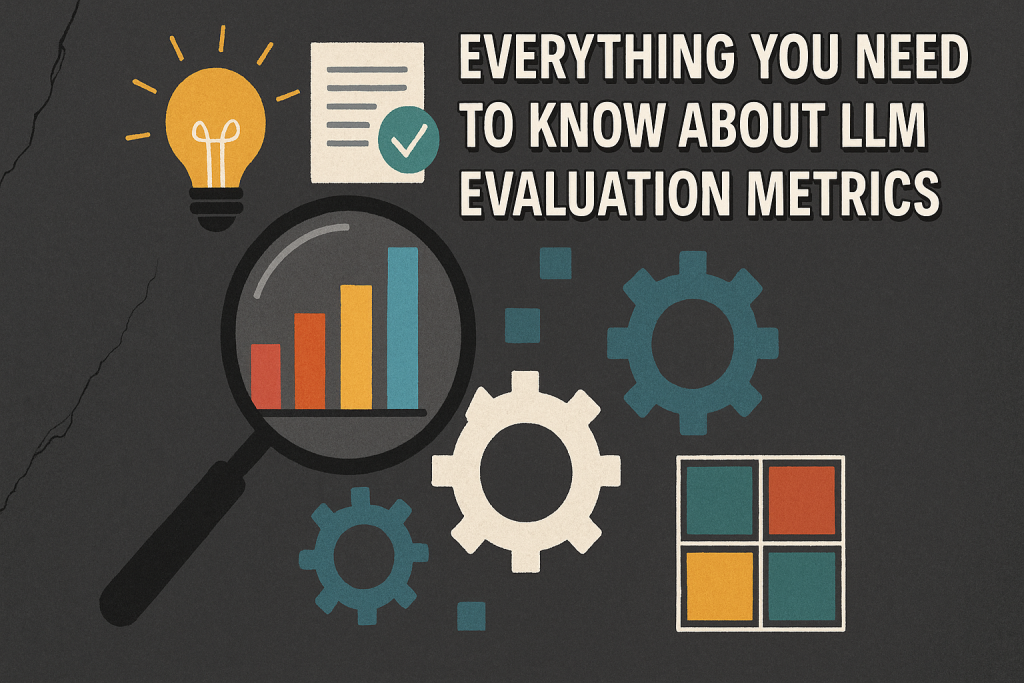
Everything You Need to Know About LLM Evaluation Metrics
In this article, you will learn how to evaluate large language models using practical metrics, reliable benchmarks, and repeatable workflows that balance quality, safety, and cost. Topics we will cover include: Text quality and similarity metrics you can automate for quick checks. When to use benchmarks, human review, LLM-as-a-judge, and verifiers. Safety/bias testing and process-level (reasoning) evaluations. Let’s get right to it. Everything You Need to Know About LLM Evaluation MetricsImage by Author Introduction When large language models first came out, most of us were just thinking about what they could do, what problems they could solve, and how far they might go. But lately, the space has been flooded with tons of open-source and closed-source models, and now the real question is: how do we know which ones are actually any good? Evaluating large language models has quietly become one of the trickiest (and surprisingly complex) problems in artificial intelligence. We really need to measure their performance to make sure they actually do what we want, and to see how accurate, factual, efficient, and safe a model really is. These metrics are also super useful for developers to analyze their model’s performance, compare with others, and spot any biases, errors, or other problems. Plus, they give a better sense of which techniques are working and which ones aren’t. In this article, I’ll go through the main ways to evaluate large language models, the metrics that actually matter, and the tools that help researchers and developers run evaluations that mean something. Text Quality and Similarity Metrics Evaluating large language models often means measuring how closely the generated text matches human expectations. For tasks like translation, summarization, or paraphrasing, text quality and similarity metrics are used a lot because they provide a quantitative way to check output without always needing humans to judge it. For example: BLEU compares overlapping n-grams between model output and reference text. It is widely used for translation tasks. ROUGE-L focuses on the longest common subsequence, capturing overall content overlap—especially useful for summarization. METEOR improves on word-level matching by considering synonyms and stemming, making it more semantically aware. BERTScore uses contextual embeddings to compute cosine similarity between generated and reference sentences, which helps in detecting paraphrases and semantic similarity. For classification or factual question-answering tasks, token-level metrics like Precision, Recall, and F1 are used to show correctness and coverage. Perplexity (PPL) measures how “surprised” a model is by a sequence of tokens, which works as a proxy for fluency and coherence. Lower perplexity usually means the text is more natural. Most of these metrics can be computed automatically using Python libraries like nltk, evaluate, or sacrebleu. Automated Benchmarks One of the easiest ways to check large language models is by using automated benchmarks. These are usually big, carefully designed datasets with questions and expected answers, letting us measure performance quantitatively. Some popular ones are MMLU (Massive Multitask Language Understanding), which covers 57 subjects from science to humanities, GSM8K, which is focused on reasoning-heavy math problems, and other datasets like ARC, TruthfulQA, and HellaSwag, which test domain-specific reasoning, factuality, and commonsense knowledge. Models are often evaluated using accuracy, which is basically the number of correct answers divided by total questions: Accuracy = Correct Answers / Total Questions Accuracy = Correct Answers / Total Questions For a more detailed look, log-likelihood scoring can also be used. It measures how confident a model is about the correct answers. Automated benchmarks are great because they’re objective, reproducible, and good for comparing multiple models, especially on multiple-choice or structured tasks. But they’ve got their downsides too. Models can memorize the benchmark questions, which can make scores look better than they really are. They also often don’t capture generalization or deep reasoning, and they aren’t very useful for open-ended outputs. You can also use some automated tools and platforms for this. Human-in-the-Loop Evaluation For open-ended tasks like summarization, story writing, or chatbots, automated metrics often miss the finer details of meaning, tone, and relevance. That’s where human-in-the-loop evaluation comes in. It involves having annotators or real users read model outputs and rate them based on specific criteria like helpfulness, clarity, accuracy, and completeness. Some systems go further: for example, Chatbot Arena (LMSYS) lets users interact with two anonymous models and choose which one they prefer. These choices are then used to calculate an Elo-style score, similar to how chess players are ranked, giving a sense of which models are preferred overall. The main advantage of human-in-the-loop evaluation is that it shows what real users prefer and works well for creative or subjective tasks. The downsides are that it is more expensive, slower, and can be subjective, so results may vary and require clear rubrics and proper training for annotators. It is useful for evaluating any large language model designed for user interaction because it directly measures what people find helpful or effective. LLM-as-a-Judge Evaluation A newer way to evaluate language models is to have one large language model judge another. Instead of depending on human reviewers, a high-quality model like GPT-4, Claude 3.5, or Qwen can be prompted to score outputs automatically. For example, you could give it a question, the output from another large language model, and the reference answer, and ask it to rate the output on a scale from 1 to 10 for correctness, clarity, and factual accuracy. This method makes it possible to run large-scale evaluations quickly and at low cost, while still getting consistent scores based on a rubric. It works well for leaderboards, A/B testing, or comparing multiple models. But it’s not perfect. The judging large language model can have biases, sometimes favoring outputs that are similar to its own style. It can also lack transparency, making it hard to tell why it gave a certain score, and it might struggle with very technical or domain-specific tasks. Popular tools for doing this include OpenAI Evals, Evalchemy, and Ollama for local comparisons. These let teams automate a lot of the evaluation without needing humans for every test.

Vivo X300, Vivo X300 Pro Official India Launch Date Confirmed; Check Expected Display, Camera, Battery, And Other Features | Technology News
Vivo X300 Series India Launch: Vivo is set to launch the Vivo X300 series in the Indian market. The series includes the Vivo X300 and X300 Pro smartphones, making their grand debut in India nearly two months after the global launch. Both models are confirmed to feature Zeiss-tuned triple rear cameras. The Vivo X300 Pro and X300 are confirmed to ship with Android 16-based OriginOS 6 out of the box. The new OS introduces Origin Island, Vivo’s take on Apple’s Dynamic Island. Notably, the company will unveil the Vivo X300 series on December 2 at 12 PM IST. However, the company has not announced whether it will be introduced through a dedicated launch event or have a soft launch. Vivo X300 Specifications (Expected) Add Zee News as a Preferred Source The Vivo X300 is expected to feature a 6.31-inch flat BOE Q10 Plus LTPO OLED display with a 1.5K resolution and 120Hz adaptive refresh rate, delivering smooth visuals and vibrant colours. Under the hood, it may run on the MediaTek Dimensity 9500 chipset, paired with up to 16GB LPDDR5X RAM and 1TB UFS 4.0 storage for fast and efficient performance. The device is powered by a 6,040mAh battery supporting 90W wired and 40W wireless charging, ensuring both speed and long-lasting endurance. The smartphone is also tipped to include an ultrasonic fingerprint sensor and boast IP68 and IP69 ratings, offering strong protection against dust, water, and high-pressure jets. On the photography front, the rear setup is expected to include a 200MP main camera, a 50MP ultra-wide lens, and a 50MP periscope telephoto sensor with 3x optical and 100x digital zoom capabilities. (Also Read: Apple iPhone 16 Pro Gets Price Cut On THIS Platform; Check Display, Camera, Battery And Other Features) Vivo X300 Pro Specifications (Expected) The Vivo X300 Pro is expected to sport a larger 6.78-inch flat BOE Q10 Plus LTPO OLED display, retaining the 1.5K resolution and 120Hz adaptive refresh rate for vibrant and fluid visuals. It is likely to be powered by the Dimensity 9500 chipset, paired with up to 16GB RAM and 1TB storage, delivering flagship-level multitasking and gaming performance. The battery capacity receives an upgrade to 6,510mAh, supported by 90W wired and 40W wireless charging for reliable endurance and fast top-ups. On the photography front, the device may feature a 50MP primary sensor, a 50MP ultra-wide lens, and a 200MP periscope telephoto camera offering 3.5x optical and 100x digital zoom, promising versatile and high-quality photography.
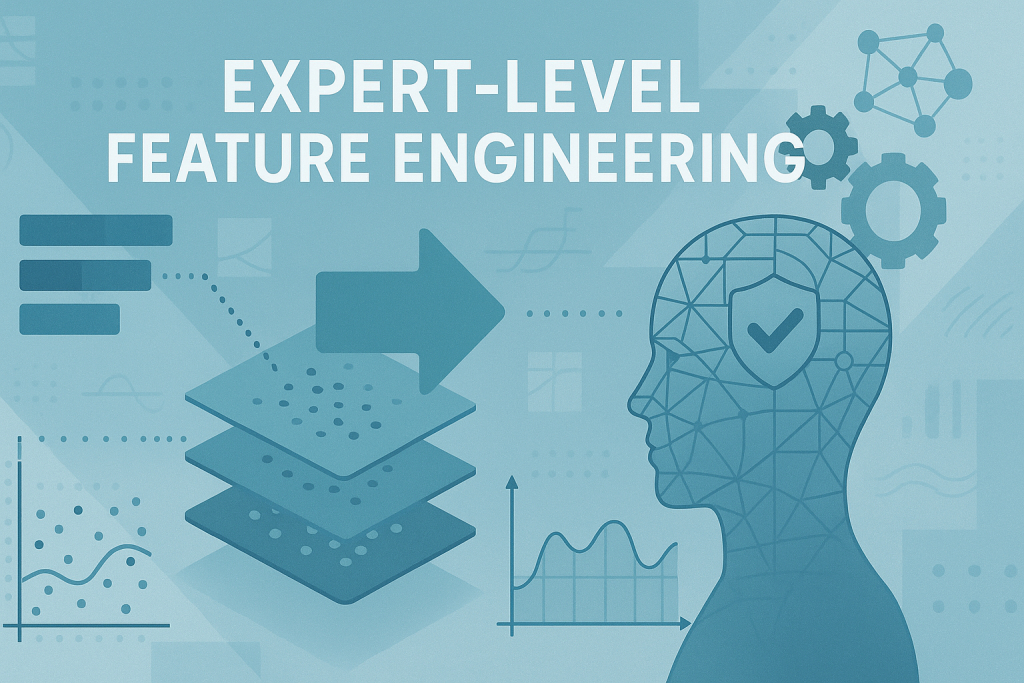
Expert-Level Feature Engineering: Advanced Techniques for High-Stakes Models
In this article, you will learn three expert-level feature engineering strategies — counterfactual features, domain-constrained representations, and causal-invariant features — for building robust and explainable models in high-stakes settings. Topics we will cover include: How to generate counterfactual sensitivity features for decision-boundary awareness. How to train a constrained autoencoder that encodes a monotonic domain rule into its representation. How to discover causal-invariant features that remain stable across environments. Without further delay, let’s begin. Expert-Level Feature Engineering: Advanced Techniques for High-Stakes ModelsImage by Editor Introduction Building machine learning models in high-stakes contexts like finance, healthcare, and critical infrastructure often demands robustness, explainability, and other domain-specific constraints. In these situations, it can be worth going beyond classic feature engineering techniques and adopting advanced, expert-level strategies tailored to such settings. This article presents three such techniques, explains how they work, and highlights their practical impact. Counterfactual Feature Generation Counterfactual feature generation comprises techniques that quantify how sensitive predictions are to decision boundaries by constructing hypothetical data points from minimal changes to original features. The idea is simple: ask “how much must an original feature value change for the model’s prediction to cross a critical threshold?” These derived features improve interpretability — e.g. “how close is a patient to a diagnosis?” or “what is the minimum income increase required for loan approval?”— and they encode sensitivity directly in feature space, which can improve robustness. The Python example below creates a counterfactual sensitivity feature, cf_delta_feat0, measuring how much input feature feat_0 must change (holding all others fixed) to cross the classifier’s decision boundary. We’ll use NumPy, pandas, and scikit-learn. import numpy as np import pandas as pd from sklearn.linear_model import LogisticRegression from sklearn.datasets import make_classification from sklearn.preprocessing import StandardScaler # Toy data and baseline linear classifier X, y = make_classification(n_samples=500, n_features=5, random_state=42) df = pd.DataFrame(X, columns=[f”feat_{i}” for i in range(X.shape[1])]) df[‘target’] = y scaler = StandardScaler() X_scaled = scaler.fit_transform(df.drop(columns=”target”)) clf = LogisticRegression().fit(X_scaled, y) # Decision boundary parameters weights = clf.coef_[0] bias = clf.intercept_[0] def counterfactual_delta_feat0(x, eps=1e-9): “”” Minimal change to feature 0, holding other features fixed, required to move the linear logit score to the decision boundary (0). For a linear model: delta = -score / w0 “”” score = np.dot(weights, x) + bias w0 = weights[0] return -score / (w0 + eps) df[‘cf_delta_feat0’] = [counterfactual_delta_feat0(x) for x in X_scaled] df.head() 1 2 3 4 5 6 7 8 9 10 11 12 13 14 15 16 17 18 19 20 21 22 23 24 25 26 27 28 29 30 31 import numpy as np import pandas as pd from sklearn.linear_model import LogisticRegression from sklearn.datasets import make_classification from sklearn.preprocessing import StandardScaler # Toy data and baseline linear classifier X, y = make_classification(n_samples=500, n_features=5, random_state=42) df = pd.DataFrame(X, columns=[f“feat_{i}” for i in range(X.shape[1])]) df[‘target’] = y scaler = StandardScaler() X_scaled = scaler.fit_transform(df.drop(columns=“target”)) clf = LogisticRegression().fit(X_scaled, y) # Decision boundary parameters weights = clf.coef_[0] bias = clf.intercept_[0] def counterfactual_delta_feat0(x, eps=1e–9): “”“ Minimal change to feature 0, holding other features fixed, required to move the linear logit score to the decision boundary (0). For a linear model: delta = -score / w0 ““” score = np.dot(weights, x) + bias w0 = weights[0] return –score / (w0 + eps) df[‘cf_delta_feat0’] = [counterfactual_delta_feat0(x) for x in X_scaled] df.head() Domain-Constrained Representation Learning (Constrained Autoencoders) Autoencoders are widely used for unsupervised representation learning. We can adapt them for domain-constrained representation learning: learn a compressed representation (latent features) while enforcing explicit domain rules (e.g., safety margins or monotonicity laws). Unlike unconstrained latent factors, domain-constrained representations are trained to respect physical, ethical, or regulatory constraints. Below, we train an autoencoder that learns three latent features and reconstructs inputs while softly enforcing a monotonic rule: higher values of feat_0 should not decrease the likelihood of the positive label. We add a simple supervised predictor head and penalize violations via a finite-difference monotonicity loss. Implementation uses PyTorch. import torch import torch.nn as nn import torch.optim as optim from sklearn.model_selection import train_test_split # Supervised split using the earlier DataFrame `df` X_train, X_val, y_train, y_val = train_test_split( df.drop(columns=”target”).values, df[‘target’].values, test_size=0.2, random_state=42 ) X_train = torch.tensor(X_train, dtype=torch.float32) y_train = torch.tensor(y_train, dtype=torch.float32).unsqueeze(1) torch.manual_seed(42) class ConstrainedAutoencoder(nn.Module): def __init__(self, input_dim, latent_dim=3): super().__init__() self.encoder = nn.Sequential( nn.Linear(input_dim, 8), nn.ReLU(), nn.Linear(8, latent_dim) ) self.decoder = nn.Sequential( nn.Linear(latent_dim, 8), nn.ReLU(), nn.Linear(8, input_dim) ) # Small predictor head on top of the latent code (logit output) self.predictor = nn.Linear(latent_dim, 1) def forward(self, x): z = self.encoder(x) recon = self.decoder(z) logit = self.predictor(z) return recon, z, logit model = ConstrainedAutoencoder(input_dim=X_train.shape[1]) optimizer = optim.Adam(model.parameters(), lr=1e-3) recon_loss_fn = nn.MSELoss() pred_loss_fn = nn.BCEWithLogitsLoss() epsilon = 1e-2 # finite-difference step for monotonicity on feat_0 for epoch in range(50): model.train() optimizer.zero_grad() recon, z, logit = model(X_train) # Reconstruction + supervised prediction loss loss_recon = recon_loss_fn(recon, X_train) loss_pred = pred_loss_fn(logit, y_train) # Monotonicity penalty: y_logit(x + e*e0) – y_logit(x) should be >= 0 X_plus = X_train.clone() X_plus[:, 0] = X_plus[:, 0] + epsilon _, _, logit_plus = model(X_plus) mono_violation = torch.relu(logit – logit_plus) # negative slope if > 0 loss_mono = mono_violation.mean() loss = loss_recon + 0.5 * loss_pred + 0.1 * loss_mono loss.backward() optimizer.step() # Latent features now reflect the monotonic constraint with torch.no_grad(): _, latent_feats, _ = model(X_train) latent_feats[:5] 1 2 3 4 5 6 7 8 9 10 11 12 13 14 15 16 17 18 19 20 21 22 23 24 25 26 27 28 29 30 31 32 33 34 35 36 37 38 39 40 41 42 43 44 45 46 47 48 49 50 51 52 53 54 55 56 57 58 59 60 61 62 63 64 65 66 import torch import torch.nn as nn import torch.optim as optim from sklearn.model_selection import train_test_split # Supervised split using the earlier DataFrame `df` X_train, X_val, y_train, y_val = train_test_split( df.drop(columns=“target”).values, df[‘target’].values, test_size=0.2, random_state=42 ) X_train = torch.tensor(X_train, dtype=torch.float32) y_train = torch.tensor(y_train, dtype=torch.float32).unsqueeze(1) torch.manual_seed(42) class ConstrainedAutoencoder(nn.Module): def __init__(self, input_dim, latent_dim=3):

Apple Launches Digital ID Feature For Secure ID Use In Apple Wallet | Technology News
New Delhi: Apple has introduced Digital ID, a new feature that allows users to create and present an ID in Apple Wallet using information from their U.S. passport. The company said the service, launched in beta, will first be accepted at Transportation Security Administration (TSA) checkpoints across more than 250 airports in the United States for domestic travel. According to an Apple press release, the Digital ID aims to provide users with a simple way to securely carry their identification on their iPhone or Apple Watch. It is designed for those who may not have a REAL ID-compliant driver’s license or state ID. However, Apple clarified that the new feature does not replace a physical passport and cannot be used for international travel or border crossings. “With the launch of Digital ID, we’re excited to expand the ways users can store and present their identity — all with the security and privacy built into iPhone and Apple Watch,” said Jennifer Bailey, Apple’s Vice President of Apple Pay and Apple Wallet. She added that users have embraced the convenience of adding driver’s licenses or state IDs since 2022, and Digital ID now extends that option to more people. Add Zee News as a Preferred Source To create a Digital ID, users can open the Wallet app, tap the “Add” button, and select “Driver’s License or ID Cards.” From there, they choose “Digital ID” and follow a verification process that includes scanning the photo page of their passport and reading the chip embedded in it for authenticity. Users must also take a selfie and complete certain facial movements to confirm their identity. Once verified, the Digital ID appears in Wallet. Presenting a Digital ID is also straightforward. Users double-click the side or Home button, select Digital ID, and hold their iPhone or Apple Watch near an identity reader. They can review the information being requested and authenticate using Face ID or Touch ID. Apple said Digital ID uses built-in security features of iPhone and Apple Watch to guard against theft and tampering. The data is encrypted and stored only on the user’s device. Apple itself cannot see when or where the ID is used, or what data is shared. Users also approve every information request through biometric authentication before sharing. The company added that more use cases will be introduced, allowing people to present their Digital ID at select businesses and organizations for identity or age verification both in person and online. Currently, users can add driver’s licenses or state IDs to Apple Wallet in 12 U.S. states and Puerto Rico, with recent expansions in Montana, North Dakota, and West Virginia, and international use beginning in Japan with the My Number Card on iPhone.
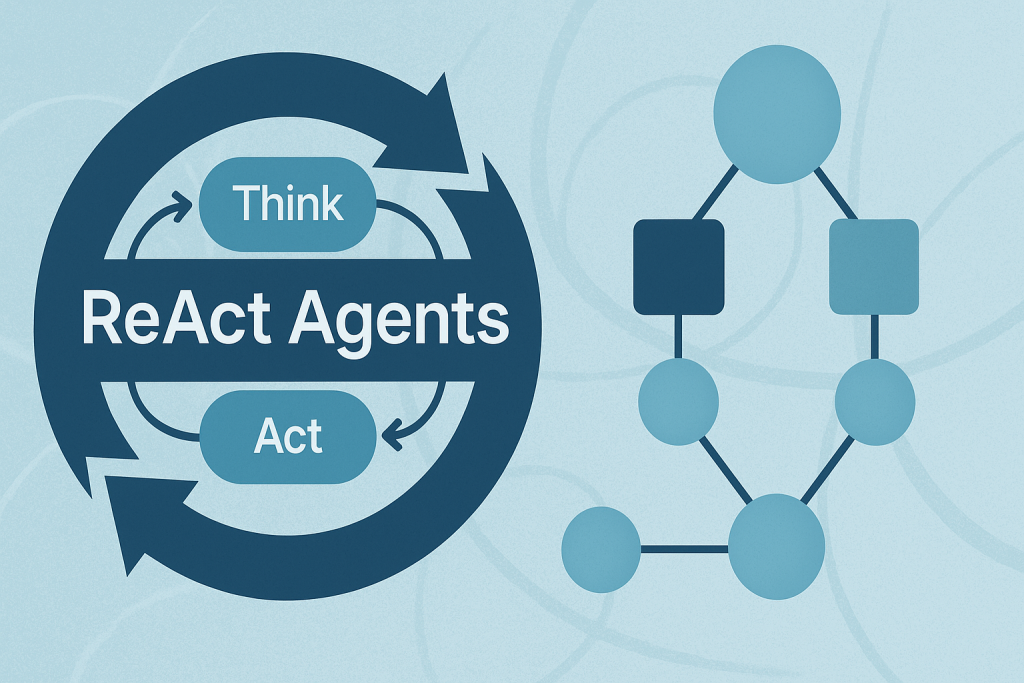
Building ReAct Agents with LangGraph: A Beginner’s Guide
In this article, you will learn how the ReAct (Reasoning + Acting) pattern works and how to implement it with LangGraph — first with a simple, hardcoded loop and then with an LLM-driven agent. Topics we will cover include: The ReAct cycle (Reason → Act → Observe) and why it’s useful for agents. How to model agent workflows as graphs with LangGraph. Building a hardcoded ReAct loop, then upgrading it to an LLM-powered version. Let’s explore these techniques. Building ReAct Agents with LangGraph: A Beginner’s GuideImage by Author What is the ReAct Pattern? ReAct (Reasoning + Acting) is a common pattern for building AI agents that think through problems and take actions to solve them. The pattern follows a simple cycle: Reasoning: The agent thinks about what it needs to do next. Acting: The agent takes an action (like searching for information). Observing: The agent examines the results of its action. This cycle repeats until the agent has gathered enough information to answer the user’s question. Why LangGraph? LangGraph is a framework built on top of LangChain that lets you define agent workflows as graphs. A graph (in this context) is a data structure consisting of nodes (steps in your process) connected by edges (the paths between steps). Each node in the graph represents a step in your agent’s process, and edges define how information flows between steps. This structure allows for complex flows like loops and conditional branching. For example, your agent can cycle between reasoning and action nodes until it gathers enough information. This makes complex agent behavior easy to understand and maintain. Tutorial Structure We’ll build two versions of a ReAct agent: Part 1: A simple hardcoded agent to understand the mechanics. Part 2: An LLM-powered agent that makes dynamic decisions. Part 1: Understanding ReAct with a Simple Example First, we’ll create a basic ReAct agent with hardcoded logic. This helps you understand how the ReAct loop works without the complexity of LLM integration. Setting Up the State Every LangGraph agent needs a state object that flows through the graph nodes. This state serves as shared memory that accumulates information. Nodes read the current state and add their contributions before passing it along. from langgraph.graph import StateGraph, END from typing import TypedDict, Annotated import operator # Define the state that flows through our graph class AgentState(TypedDict): messages: Annotated[list, operator.add] next_action: str iterations: int from langgraph.graph import StateGraph, END from typing import TypedDict, Annotated import operator # Define the state that flows through our graph class AgentState(TypedDict): messages: Annotated[list, operator.add] next_action: str iterations: int Key Components: StateGraph: The main class from LangGraph that defines our agent’s workflow. AgentState: A TypedDict that defines what information our agent tracks. messages: Uses operator.add to accumulate all thoughts, actions, and observations. next_action: Tells the graph which node to execute next. iterations: Counts how many reasoning cycles we’ve completed. Creating a Mock Tool In a real ReAct agent, tools are functions that perform actions in the world — like searching the web, querying databases, or calling APIs. For this example, we’ll use a simple mock search tool. # Simple mock search tool def search_tool(query: str) -> str: # Simulate a search – in real usage, this would call an API responses = { “weather tokyo”: “Tokyo weather: 18°C, partly cloudy”, “population japan”: “Japan population: approximately 125 million”, } return responses.get(query.lower(), f”No results found for: {query}”) # Simple mock search tool def search_tool(query: str) -> str: # Simulate a search – in real usage, this would call an API responses = { “weather tokyo”: “Tokyo weather: 18°C, partly cloudy”, “population japan”: “Japan population: approximately 125 million”, } return responses.get(query.lower(), f“No results found for: {query}”) This function simulates a search engine with hardcoded responses. In production, this would call a real search API like Google, Bing, or a custom knowledge base. The Reasoning Node — The “Brain” of ReAct This is where the agent thinks about what to do next. In this simple version, we’re using hardcoded logic, but you’ll see how this becomes dynamic with an LLM in Part 2. # Reasoning node – decides what to do def reasoning_node(state: AgentState): messages = state[“messages”] iterations = state.get(“iterations”, 0) # Simple logic: first search weather, then population, then finish if iterations == 0: return {“messages”: [“Thought: I need to check Tokyo weather”], “next_action”: “action”, “iterations”: iterations + 1} elif iterations == 1: return {“messages”: [“Thought: Now I need Japan’s population”], “next_action”: “action”, “iterations”: iterations + 1} else: return {“messages”: [“Thought: I have enough info to answer”], “next_action”: “end”, “iterations”: iterations + 1} # Reasoning node – decides what to do def reasoning_node(state: AgentState): messages = state[“messages”] iterations = state.get(“iterations”, 0) # Simple logic: first search weather, then population, then finish if iterations == 0: return {“messages”: [“Thought: I need to check Tokyo weather”], “next_action”: “action”, “iterations”: iterations + 1} elif iterations == 1: return {“messages”: [“Thought: Now I need Japan’s population”], “next_action”: “action”, “iterations”: iterations + 1} else: return {“messages”: [“Thought: I have enough info to answer”], “next_action”: “end”, “iterations”: iterations + 1} How it works: The reasoning node examines the current state and decides: Should we gather more information? (return “action”) Do we have enough to answer? (return “end”) Notice how each return value updates the state: Adds a “Thought” message explaining the decision. Sets next_action to route to the next node. Increments the iteration counter. This mimics how a human would approach a research task: “First I need weather info, then population data, then I can answer.” The Action Node — Taking Action Once the reasoning node decides to act, this node executes the chosen action and observes the results. # Action node – executes the tool def action_node(state: AgentState): iterations = state[“iterations”] # Choose query based on iteration query = “weather tokyo” if iterations == 1 else “population japan” result = search_tool(query) return {“messages”: [f”Action: Searched for ‘{query}’”, f”Observation: {result}”], “next_action”: “reasoning”} # Router – decides next step def route(state: AgentState):

OnePlus 15 Launched In India With Snapdragon 8 Elite Gen 5 Chipset; Check Display, Camera, Battery, Price And Other Features | Technology News
OnePlus 15 India Launch: Chinese smartphone manufacturer OnePlus has launched the OnePlus 15 smartphone in India today. It is the first smartphone in India to feature Qualcomm’s newest and fastest chipset. The smartphone comes loaded with several AI-powered features, including Plus Mind, Google’s Gemini AI, AI Recorder, AI Portrait Glow, AI Scan, and AI PlayLab. The newly-launched smartphone comes preloaded with OxygenOS 16 based on Android 16, featuring a redesigned “Liquid Glass”-inspired interface, enhanced customization options, and new AI capabilities. The OnePlus 15 adopts a flat display, a revamped squarish camera island if compared to the OnePlus 13. The OnePlus 15 also introduces the new Plus button first seen on the OnePlus 13s. OnePlus 15 India Launch: Specifications Add Zee News as a Preferred Source The OnePlus 15 features a 6.78-inch LTPO AMOLED display with 1.5K resolution and a 165Hz refresh rate, delivering up to 1,800 nits of peak brightness. The screen also includes Eye Comfort for Gaming, Motion Cues, Eye Comfort Reminders, and Reduce White Point, all within ultra-thin 1.15mm bezels. It runs on OxygenOS 16, which brings the AI Call Assistant for real-time language translation and Google Gemini integration that lets the AI chatbot access your screenshots and notes in OnePlus’ Mind Space app. The smartphone is powered by a massive 7,300mAh silicon-carbon battery with support for 120W SuperVOOC wired and 50W AirVOOC wireless fast charging. On the photography front, the smartphone comes with a 50-megapixel triple rear camera capable of 8K video recording. For selfies and video chats, there is a 32-megapixel shooter at the front. On the connectivity front, the smartphone comes with a 5G, Wi-Fi 7, Bluetooth 6.0, USB 3.2 Gen 1 Type-C, and satellite navigation support via GPS, GLONASS, Galileo, QZSS, and NavIC. On the security front, the smartphone comes with an in-display ultrasonic fingerprint scanner, and the phone carries an IP66+IP68+IP69+IP69K rating for dust and water resistance. To manage thermals, it features a 5,731 sq mm 3D vapor chamber as part of its 360 Cryo-Velocity Cooling system. (Also Read: iQOO 15 Set To Launch In India On November 26: Price, Features, And Pre-Booking Details Revealed) OnePlus 15 India Launch: Price, Availability And Launch Offers The base model with 12GB RAM and 256GB storage is priced at Rs 72,999, while the 16GB RAM and 512GB storage variant costs Rs 75,999. Notably, the smartphone will go on sale in India from November 13 at 8 PM IST. For a limited time, buyers will get a free pair of OnePlus Nord Buds 3, a lifetime display warranty, and an upgrade bonus of up to Rs 4,000. Adding further, the OnePlus 15 customers will receive three free months of Google AI Pro with extra storage and features. Meanwhile, the HDFC Bank cardholders can enjoy a Rs 4,000 discount on both variants, bringing the prices down to Rs 68,999 and Rs 71,999, respectively.